The Simple ToPCAT Roughness Tool takes in a raw point cloud file as input and outputs a surface roughness raster. To do this it leverages ToPCAT to decimate the point cloud file and calculate the locally detrended standard deviation based on the elevation values in the user defined sample window and minimum points to calculate statistics.
The output surface roughness model can be used as i) a roughness height model, ii) a metric of uncertainty (where roughness is predominant component of uncertainty), and/or iii) an input to a fuzzy inference system surface uncertainty model.
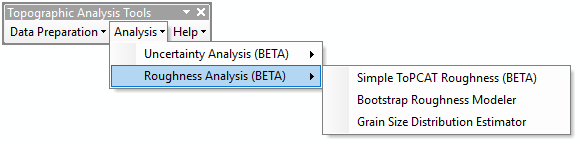
The Simple ToPCAT Roughess Tool is located under the Analysis menu and further the Roughness Analysis menu:
The video below describes how to use the Simple ToPCAT Roughness Tool:
When the Simple ToPCAT Roughness tool is run, the following dialog appears:
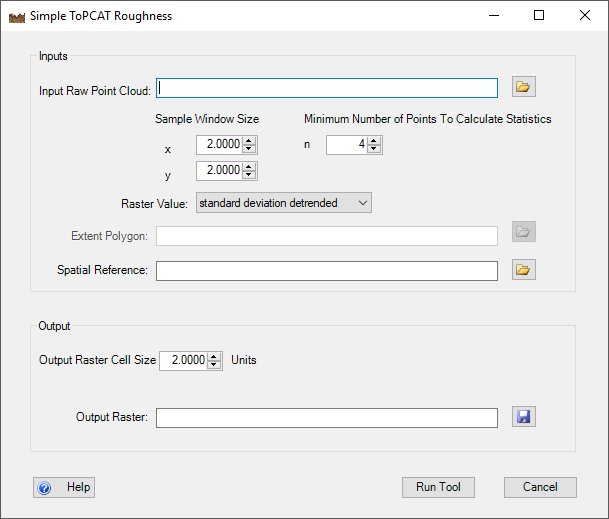
INPUTS:
The inputs for this tool are:
- raw point cloud
- Formatted into space delimited columns of x,y,z.
- X and Y sample window dimensions
- Dimensions in units of the raw survey file to define the size of the sample window used to calculate statistics from.
- Minimum number of points in sample window to calculate statistics
- To calculate many of its output statistics multiple points are needed within a sample window. The default minimum number is 4 points.
- Raster Value
- When creating a surface roughness raster the user should use the default value of standard deviation detrended.
- However this tool can also be used to create rasters for any of the statistics calculated by the ToPCAT algorithm. All of these statistics can be selected from this drop-down list
- Spatial Reference (optional)
- can be in the form of a .prj file or you can load an existing shapefile that contains a spatial reference and that spatial reference will be imported.
OUTPUTS:
The outputs for the tool are:
- Surface Roughness Raster*
- raster whose values are the locally detrended standard deviation of the cell.
- If a user selects a different value from the Raster Value drop-down menu, the value selected from this drop-down will be used to create the output raster.
 Back to TAT Home