For conceptual background on this tool and the analysis that can be used with its output click here.
Accessing the Tool
The Interpolation Error Surface Tool is located under the Analysis menu under the Uncertainty Analysissub menu and the Raster Based sub menu therein:

Using the Tool
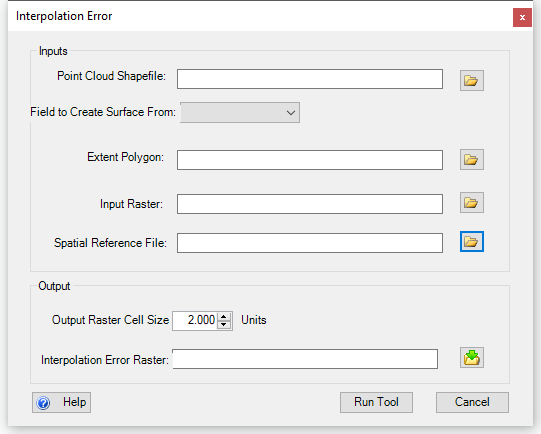
When the Interpolation Error Surface Tool is run, the following dialog appears:

The video below describes how to use the Interpolation Error Surface Tool:
INPUTS:
The inputs for this tool are:
- Point Cloud Shapefile
- point shapefile containing the original surveyed z values. This file can be created using the
Create Point Feature Class Tooll located under the Data Preparation tab.
- point shapefile containing the original surveyed z values. This file can be created using the
- Field to Create Surface From
- This drop-down list will automatically populate with fields from the point cloud shapefile.
- Generally when using this tool to create a interpolation error surface to be used in a geomorphic change detection study the field containing the elevation values would be selected. However any field can be used to see interpolation error values for that field.
- Extent Polygon
- polygon shapefile of the survey extent for the point cloud shapefile. This can be created through in GCD with the
Create Bounding Polygontool or theSurvey Extent Polygon Tool.
- polygon shapefile of the survey extent for the point cloud shapefile. This can be created through in GCD with the
- Input Raster
- The raster that was interpolated from the point cloud shapefile.
- Spatial Reference (optional)
- can be in the form of a
*.prjfile or you can load an existing shapefile that contains a spatial reference and that spatial reference will be imported. This is auto-populated if your point cloud shapefile includes a spatial reference.
- can be in the form of a
- Cell Size of Output Raster
- The cell size to for the interpolation error raster. 2 feet is currently the default.
OUTPUTS:
The outputs for the tool are:
- Interpolation Error Raster
- This raster is created from the average difference between surveyed points and the cell that they are within the DEM they were used to create. The absolute value of difference is taken because statistical analysis of the overall distribution of the difference between surveyed points and DEM values is more robust when positive and negative values do not cancel each other out.
 Back to TAT Home